
Chronic pain affects tens of millions of Americans, and the clinics that treat them are under growing pressure to show that their interventions actually work. Remote Therapeutic Monitoring, or RTM, offers a way to track patients between visits and catch problems early. But not all RTM platforms are the same. The outcomes a clinic gets depend almost entirely on the quality of the technology it chooses.
We analyzed data from Arizona Pain, a large multi specialty pain management clinic that uses the Actuvi platform for its RTM program. The dataset is substantial: 831 patients, 51,265 individual assessments, and 15 months of continuous monitoring from January 2025 through March 2026.
What we found was clear and consistent. Patients on the Actuvi platform got better, and the more they engaged with it, the better they got. Pain went down. Medication adherence went up. And in one of the more surprising findings, depression and anxiety improved too, even though these patients were not being treated for mental health. The sections that follow lay out exactly what the data shows and what it means for clinics considering RTM.
Key Findings At A Glance
72% of patients saw real, noticeable improvement in their pain (at least a 1.5 point drop on a 10 point scale, which patients consistently describe as a meaningful change in how they feel). Most reached this point within 10 days, and continued getting better for weeks after that.
Patients who used the platform regularly were 5.2 times more likely to hit a major improvement milestone (a 2 point drop, the MCID) than patients who barely engaged. This was statistically confirmed at p < 0.0001.
59% of highly engaged patients showed measurable improvement, 22% more than those with low engagement. The more patients used the platform, the better their outcomes.
37% of patients experienced significant pain improvement, pain relief that leads to better day to day function.
Medication compliance rose to 91%, and the vast majority of patients kept it there. In a population where skipping medications is one of the biggest reasons treatments fail, that matters.
Depression and anxiety improved alongside pain, even though none of these patients were receiving mental health treatment. Responders saw over 35% improvement in both areas. Better pain management, it turns out, is itself a form of mental health care.
75% of patients who improved held onto their gains in their most recent readings, showing these are lasting results, not a temporary bump.
The RTM Landscape
In 2022, the Centers for Medicare & Medicaid Services created billing codes specifically for Remote Therapeutic Monitoring. For the first time, clinics could get reimbursed for digitally tracking patients with chronic pain, musculoskeletal issues, and rehab needs between office visits. The market opportunity is enormous: over 100 million Americans live with these conditions.
But many clinics have struggled to make RTM work in practice. Patients don't engage. The data that gets collected sits unused. Payers want proof that the monitoring is actually changing outcomes. And most of the off the shelf tools available today only capture one dimension of a patient's health, which limits the insights clinicians can draw. The result is that for a lot of clinics, RTM has become a billing exercise rather than a clinical one.
The Actuvi Platform
Actuvi was built to solve this problem. Instead of tracking just one metric, the platform captures pain, mood, medication adherence, physical activity, side effects, and treatment effectiveness, all through a single daily patient workflow. This gives clinicians a complete picture of how a patient is doing, not just a pain score.
The result is richer data, better engagement, and the ability to spot patterns that simpler tools miss entirely. This paper takes a close look at the outcomes the platform produced for Arizona Pain and examines what those results mean for the broader RTM market.
Study Overview
Patients and Data
This study looked at 831 patients enrolled in an RTM program at Arizona Pain, a multi specialty pain management clinic in the United States. These patients collectively submitted 51,265 assessments between January 2025 and March 2026 across several instruments: a daily pain assessment, a daily medication adherence log, a weekly rehabilitation progress check, and a weekly pain progress tracker.
How We Measured Outcomes
We used different methods for different types of data, because not all health metrics work the same way. A daily pain score is a different kind of measurement than a weekly self report on mood, and a yes/no medication log is different from both.
For most analyses, we compared each patient's earliest readings (their baseline) against their most recent readings. We used a window of 5 to 10 readings to smooth out day to day noise and required a minimum number of entries to make sure we had enough data to draw conclusions. The specific method for each analysis is documented in its methodology note.
Health Outcomes
1. How Quickly Patients Improved, and How Much
Methodology. We set each patient's baseline as the average of their first two pain readings. We then defined "meaningful improvement" as a drop of at least 1.5 points below that baseline, confirmed by a follow up reading at or below the same level. On a 0 to 10 scale, a 1.5 point drop is the point where patients consistently say they can feel a real difference in their day to day life. We included 486 patients who had at least 6 recorded responses.
Nearly three out of four patients (72%) reached this improvement threshold. Most of them got there fast. The typical patient crossed the threshold in just 10 days. To put that in context, in a traditional clinic setting, a patient might wait four to six weeks for a follow up appointment before anyone even knows whether the treatment is working.
But the real outcome is what happened next. Getting to the first threshold was not the end. 72% of those initial responders kept getting better, picking up an additional 1.5 points of improvement on average. Patients who reached the more demanding 2 point milestone (MCID) early in the program saw total reductions of 70% from their starting pain levels. And three quarters of all responders sustained their gains when we looked at their most recent readings, which tells us these improvements are lasting.
This matters for a practical reason. When patients see improvement within days, they stay engaged. They keep filling out their daily assessments. They keep taking their medications. And when a patient is not improving, the platform surfaces that signal early, so the provider can step in and adjust the plan before the patient gives up.
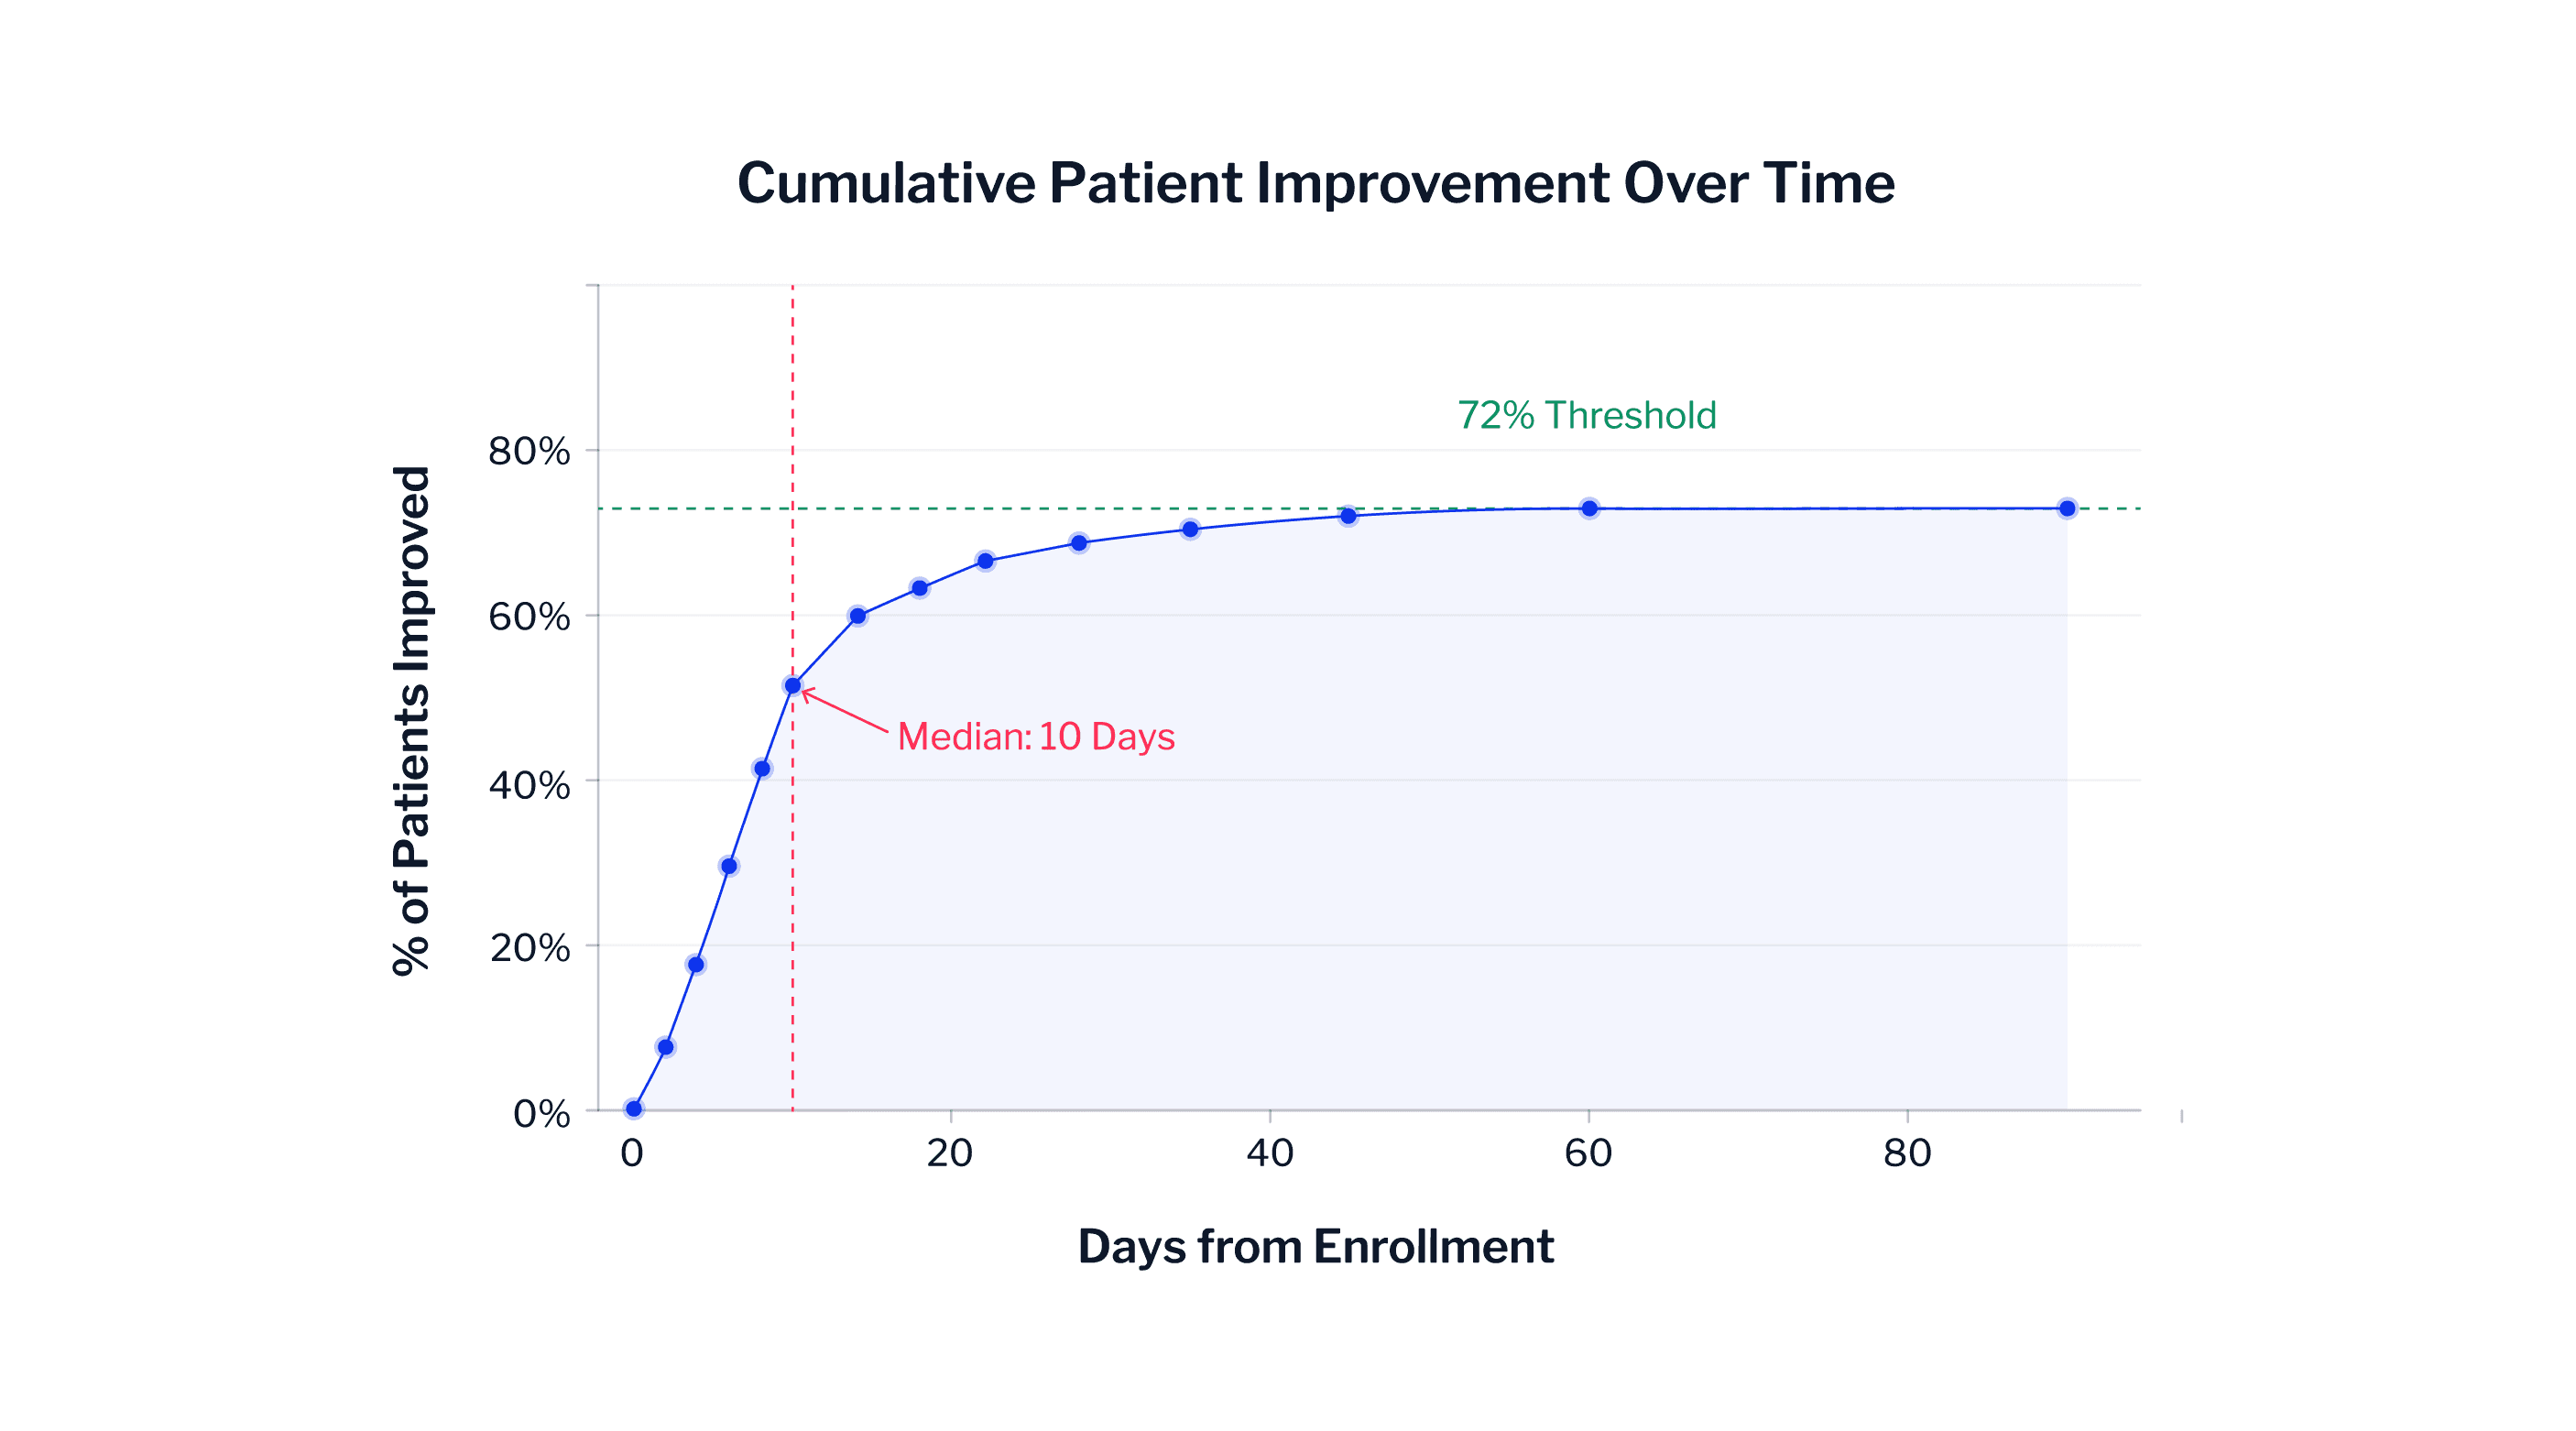
Cumulative Patient Improvement Over Time
The Bottom Line. 72% of patients achieved meaningful improvement on the Actuvi platform. Most got there within 10 days, and the majority continued to improve well beyond that initial milestone. For clinicians, the platform turns what used to be a weeks long guessing game into a data driven feedback loop that catches both successes and problems in real time.
2. The Overall Picture on Pain
Methodology. We captured daily pain scores on a 0 to 10 scale through the Daily Pain Assessment. For each patient, we compared the average of their first 5 readings against their last 5 readings, requiring at least 10 total readings for inclusion. This gave us 431 patients.
Across all 431 patients, pain dropped by 8% on average. That is the number for the entire group, including patients whose pain stayed flat or went up slightly. Among the patients who did respond, the average improvement was 30%, which represents a major change in how someone experiences their day.
37% of patients experienced significant pain improvement of at least a full point on the scale. For patients living with chronic pain, a full point is the difference between a day spent managing symptoms and a day spent living more normally. At the other end, only 2.6% of patients saw any major worsening, which tells us the platform is reliably pushing outcomes in the right direction.
3. The Best Result Any Patient Achieved
Methodology. We looked at each patient's highest recorded pain score and then found the lowest score they recorded after that point. The gap between those two numbers represents the best improvement a patient experienced at any point during their time on the platform, even if they did not stay at that level. We had 363 patients for this analysis.
The average patient experienced a peak improvement of 4.5 points on the 10 point scale. 75% of patients hit a peak improvement of 3 points or more at some point during their program. These are large numbers. A patient who started at an 8 and at some point reached a 3 or 4 experienced a fundamentally different quality of life in that period.
For clinicians, this is useful information. If a patient once achieved a 4 point improvement, that sets a benchmark. The provider knows what is possible for that patient and can work to recreate the conditions, whether it was a medication change, a period of higher engagement, or something different, that produced that result.
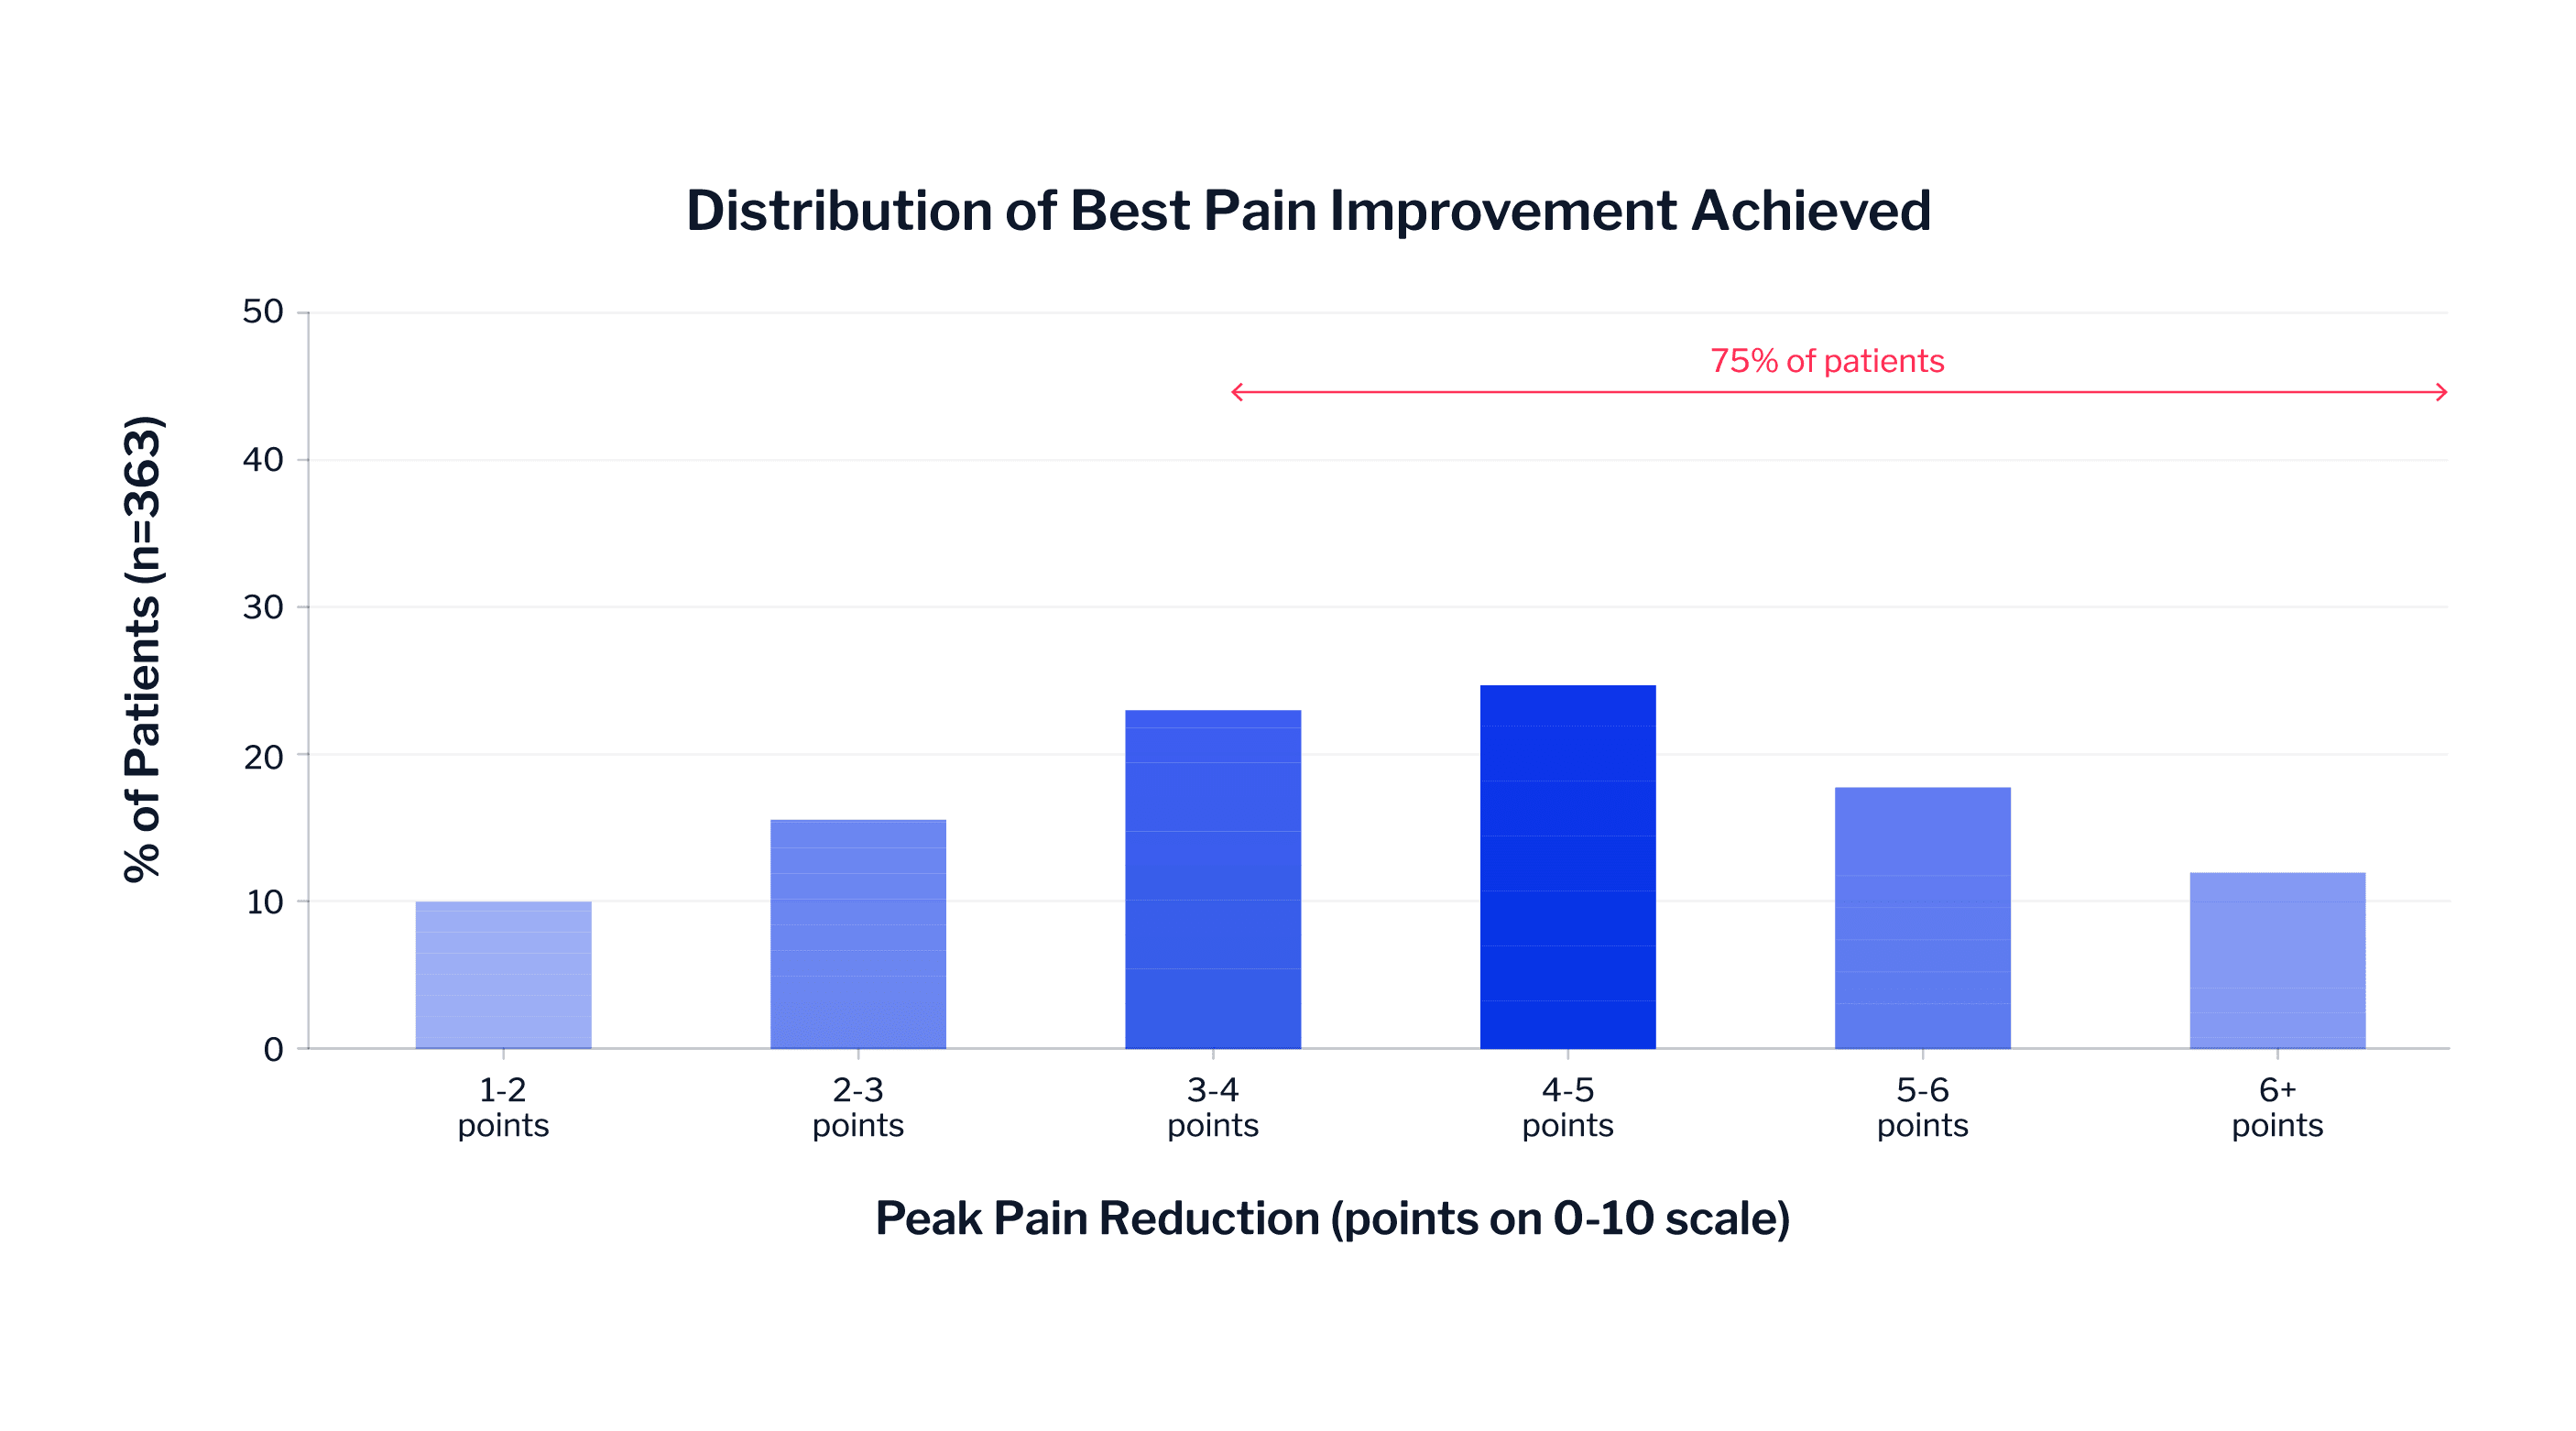
Distribution of Best Pain Improvement Achieved
Patient Engagement and Its Impact on Outcomes
1. How the Data Shows (431 Patients)
Methodology. We divided patients into four groups based on how many responses they submitted: Low (under 15), Medium Low (15 to 49), Medium High (50 to 79), and High (80 or more). We compared each group's early pain readings against their later ones and looked at how many patients in each group hit the 2 point improvement milestone (known as the MCID). We confirmed the statistical significance of the pattern using a chi square test (p < 0.0001).
Patients in the highest engagement group improved at a rate of 59%, which was 22% better than the lowest engagement group. They also saw more than double the average pain reduction. But the most striking number is this: highly engaged patients were 5.2 times more likely to reach the 2 point improvement milestone.
This was not an all or nothing effect. Each tier of engagement produced better results than the one below it. Patients with medium engagement did better than low, medium high did better than medium, and high did better than all of them. That steady progression tells us something important, it is not just that motivated patients happen to use the platform more. The platform itself is contributing to better outcomes by giving patients structure, giving providers data, and creating a feedback loop that reinforces engagement.
Why This Matters. Engagement is the most powerful lever any RTM program has. The 5.2x difference in major clinical outcomes between high and low engagement patients is one of the largest effects documented in this paper. Choosing a platform that patients actually want to use is not a nice to have. It is the single biggest determinant of whether the program works.
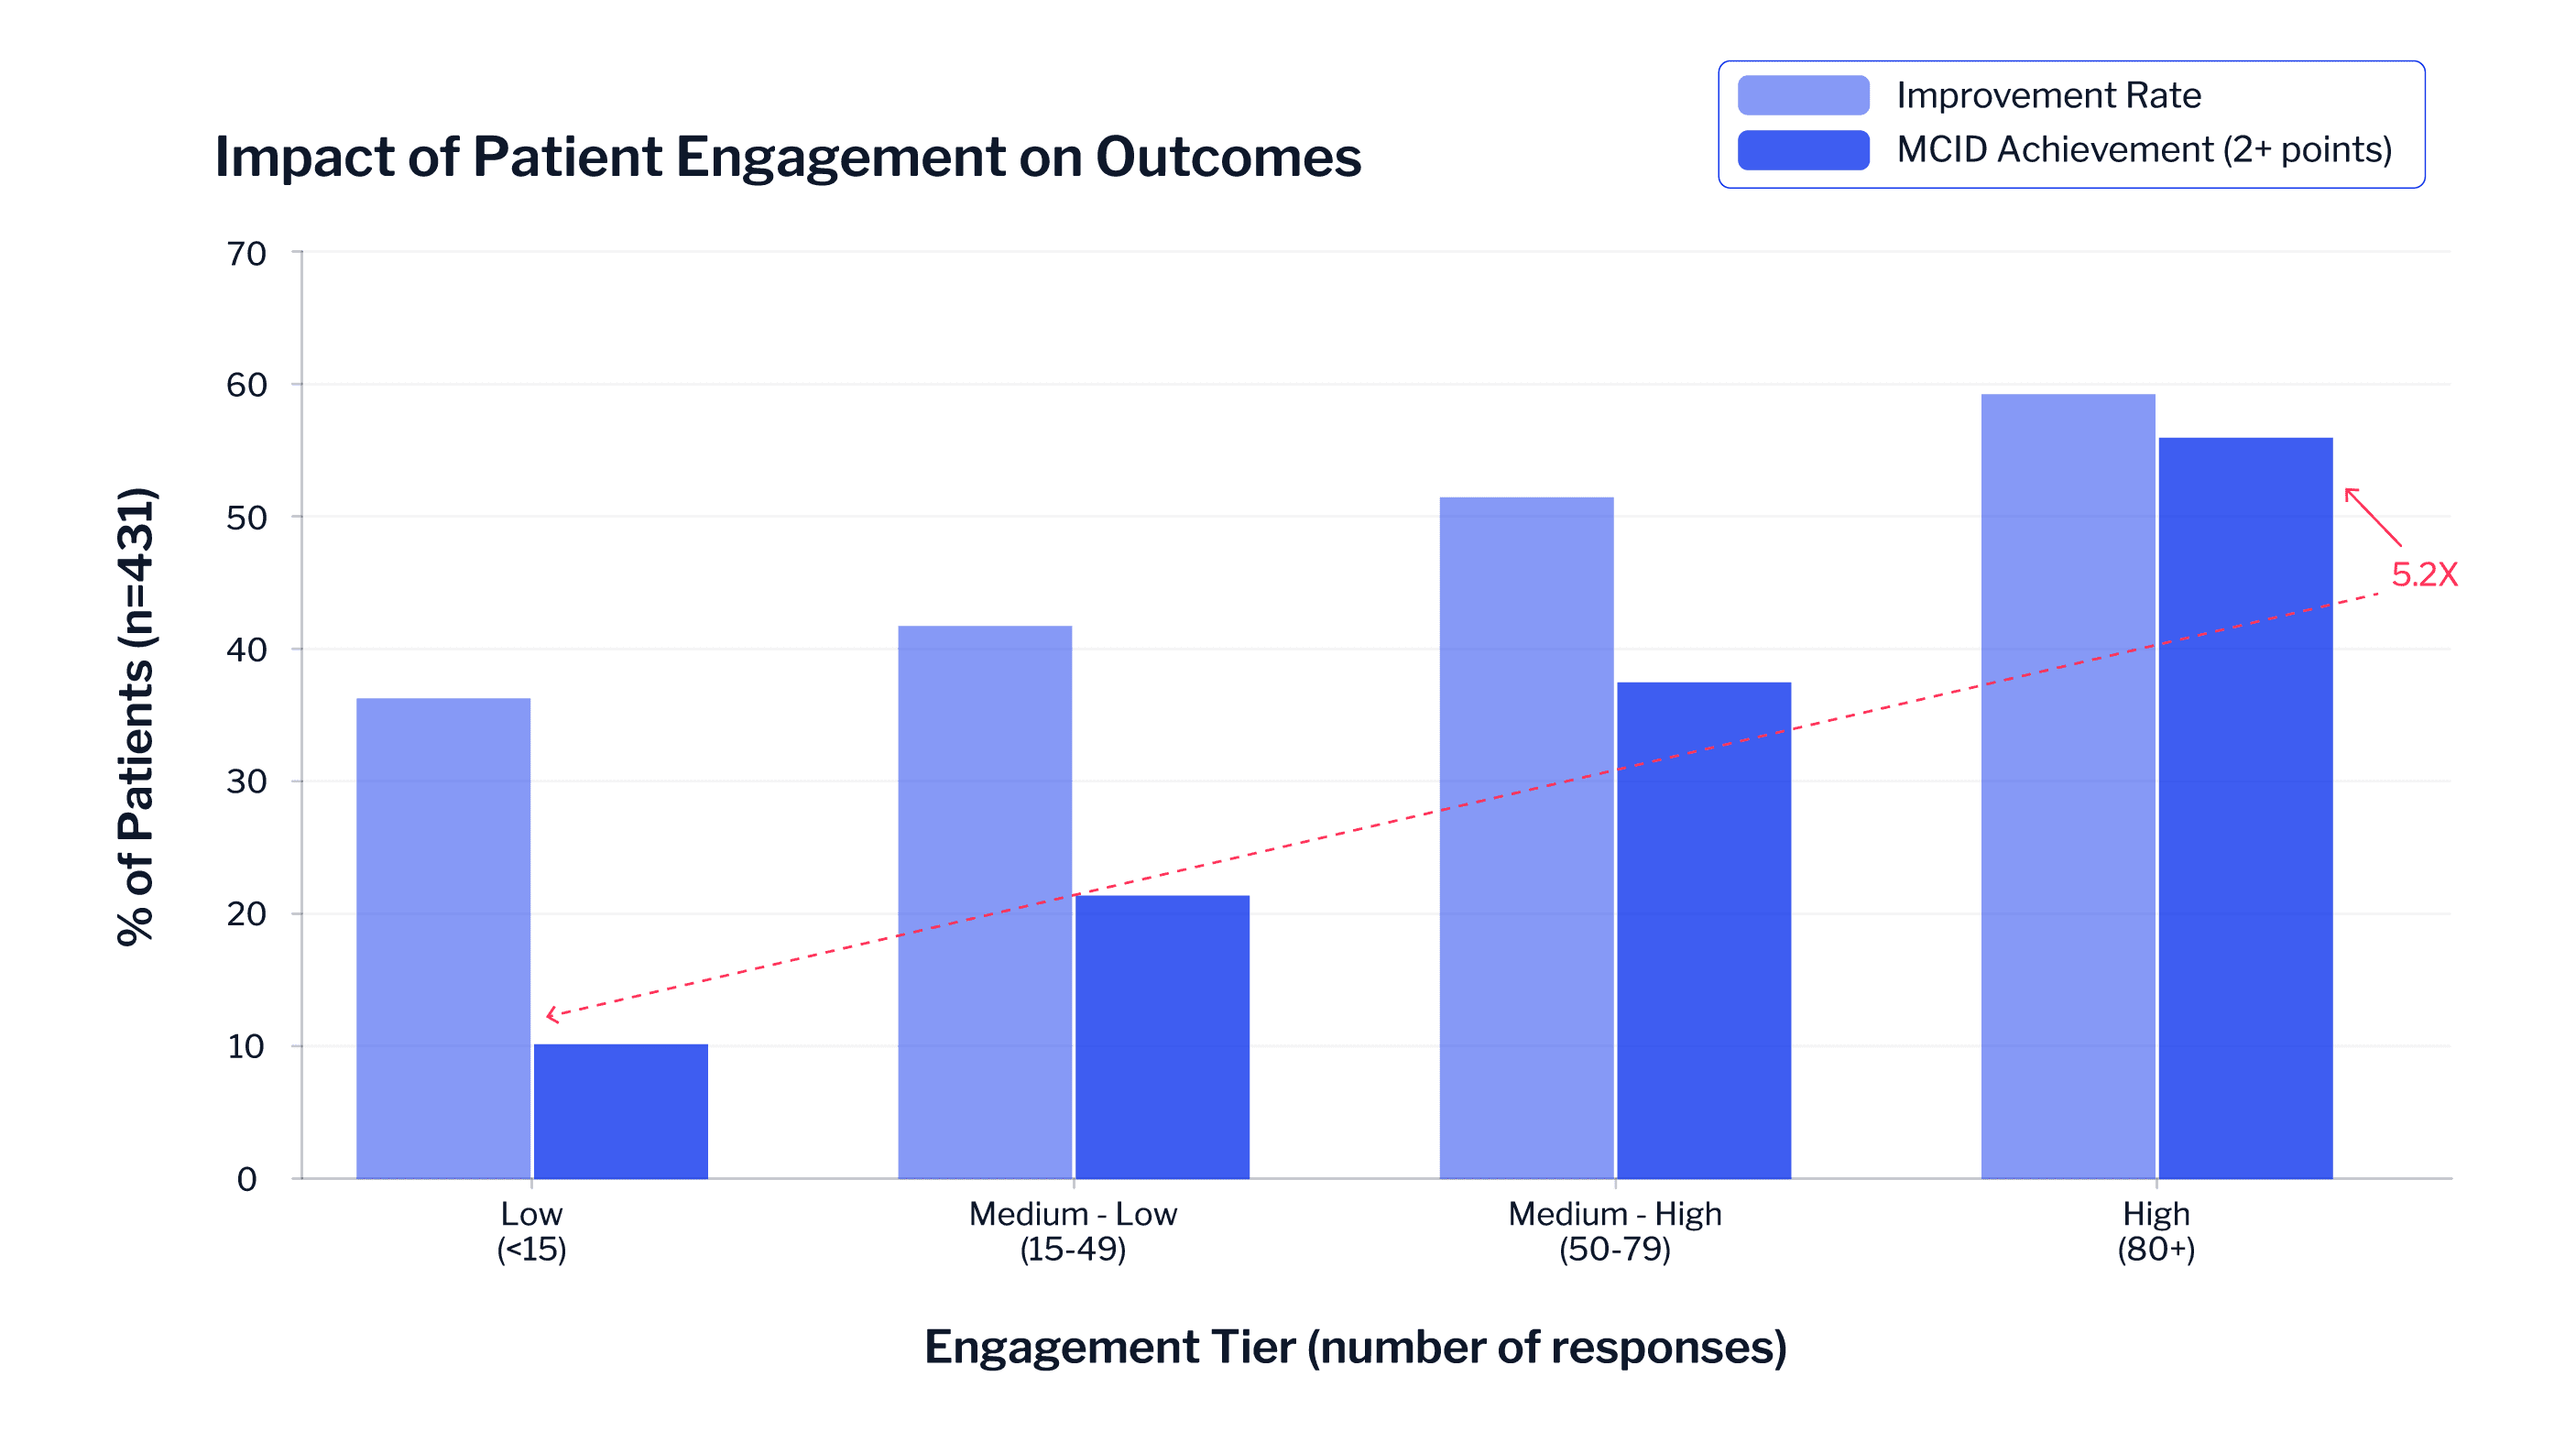
Impact of Patient Engagement on Outcomes
2. Why More Engagement Leads to Better Outcomes
When patients check in daily, three things happen. First, their providers get current information on pain, mood, and medication, which means they can make adjustments sooner instead of waiting for the next office visit. Second, the daily routine of logging their medications reinforces the habit of actually taking them, which directly improves compliance. Third, the accumulated data gives clinicians a much richer picture of what is and what is not working, so their decisions are better informed.
These then compound over time. A patient who engages consistently for two months generates enough data for a provider to see real trends. A patient who checks in sporadically gives the provider very little to work with. That is why we see such a strong, graded relationship between engagement and outcomes. It is not motivation alone. It is the clinical intelligence that consistent engagement produces.
Medication Adherence
1. Adherence Improvement Over Time (90 Patients, 8,504 Responses)
Methodology. Patients logged whether they took their medication each day (yes or no) through the Daily Medication Adherence tool. We compared the average of their first 5 entries against their last 5 entries, requiring at least 10 entries for inclusion.
Medication compliance across the cohort reached 91%. The vast majority of patients maintained consistently high adherence throughout their time on the platform, with fewer than 7% showing any decline. Those who did improve saw their compliance rates go up by more than half on average.
This might sound like a small detail, but in pain management, it is one of the most important numbers in the entire study. Poor medication adherence is one of the top reasons pain treatments fail. Patients forget doses, stop taking medications when they feel better, or quit when side effects bother them. The fact that the platform's daily check in structure kept adherence high and stable across this population suggests it is doing exactly what it should, turning medication compliance into something that is built into the patient's daily routine.
Mental Health: The Downstream Effect of Better Pain Management
None of the patients in this study were being treated for depression or anxiety. Every single one of them was enrolled in the program for pain management. And yet, as their pain improved, their mental health improved right alongside it.
How Pain Reduction Drove Mental Health Improvement
Methodology. Patients self reported depression and anxiety on a 0 to 10 scale as part of their daily pain assessment. We compared early readings against recent ones using the same first 5 vs. last 5 approach. We also ran correlation analysis at three levels: across all individual readings, at the population level (averaging pain at each depression/anxiety score), and at the per patient level (tracking whether changes in one dimension moved together with changes in the other).
42% of patients showed improvement in depression, and 43% improved in anxiety. Among those who improved, the average reduction was over 35% in both areas. No one was treating these patients for mental health. The improvement came as a byproduct of getting their pain under control.
The correlation data makes the connection even clearer. At the population level, pain and depression move almost perfectly in sync (r = 0.94), and pain and anxiety are even more closely linked (r = 0.96). What that means is this, when patients' pain goes down, their depression and anxiety go down by almost exactly the same amount. Patients whose pain improved the most also showed the biggest mental health improvements, confirming that managing pain leads to better mental health outcomes.
This is one of the most important practical findings in the study. A clinic using the Actuvi platform can show, with real data, that its pain interventions are producing mental health benefits too. That is valuable for patient conversations, payer negotiations, and clinical decision making. And it is only possible because the platform captures all of these dimensions in a single daily workflow. A tool that tracks pain alone would never surface this connection.

Pain and Mental Health Move Almost Perfectly Together
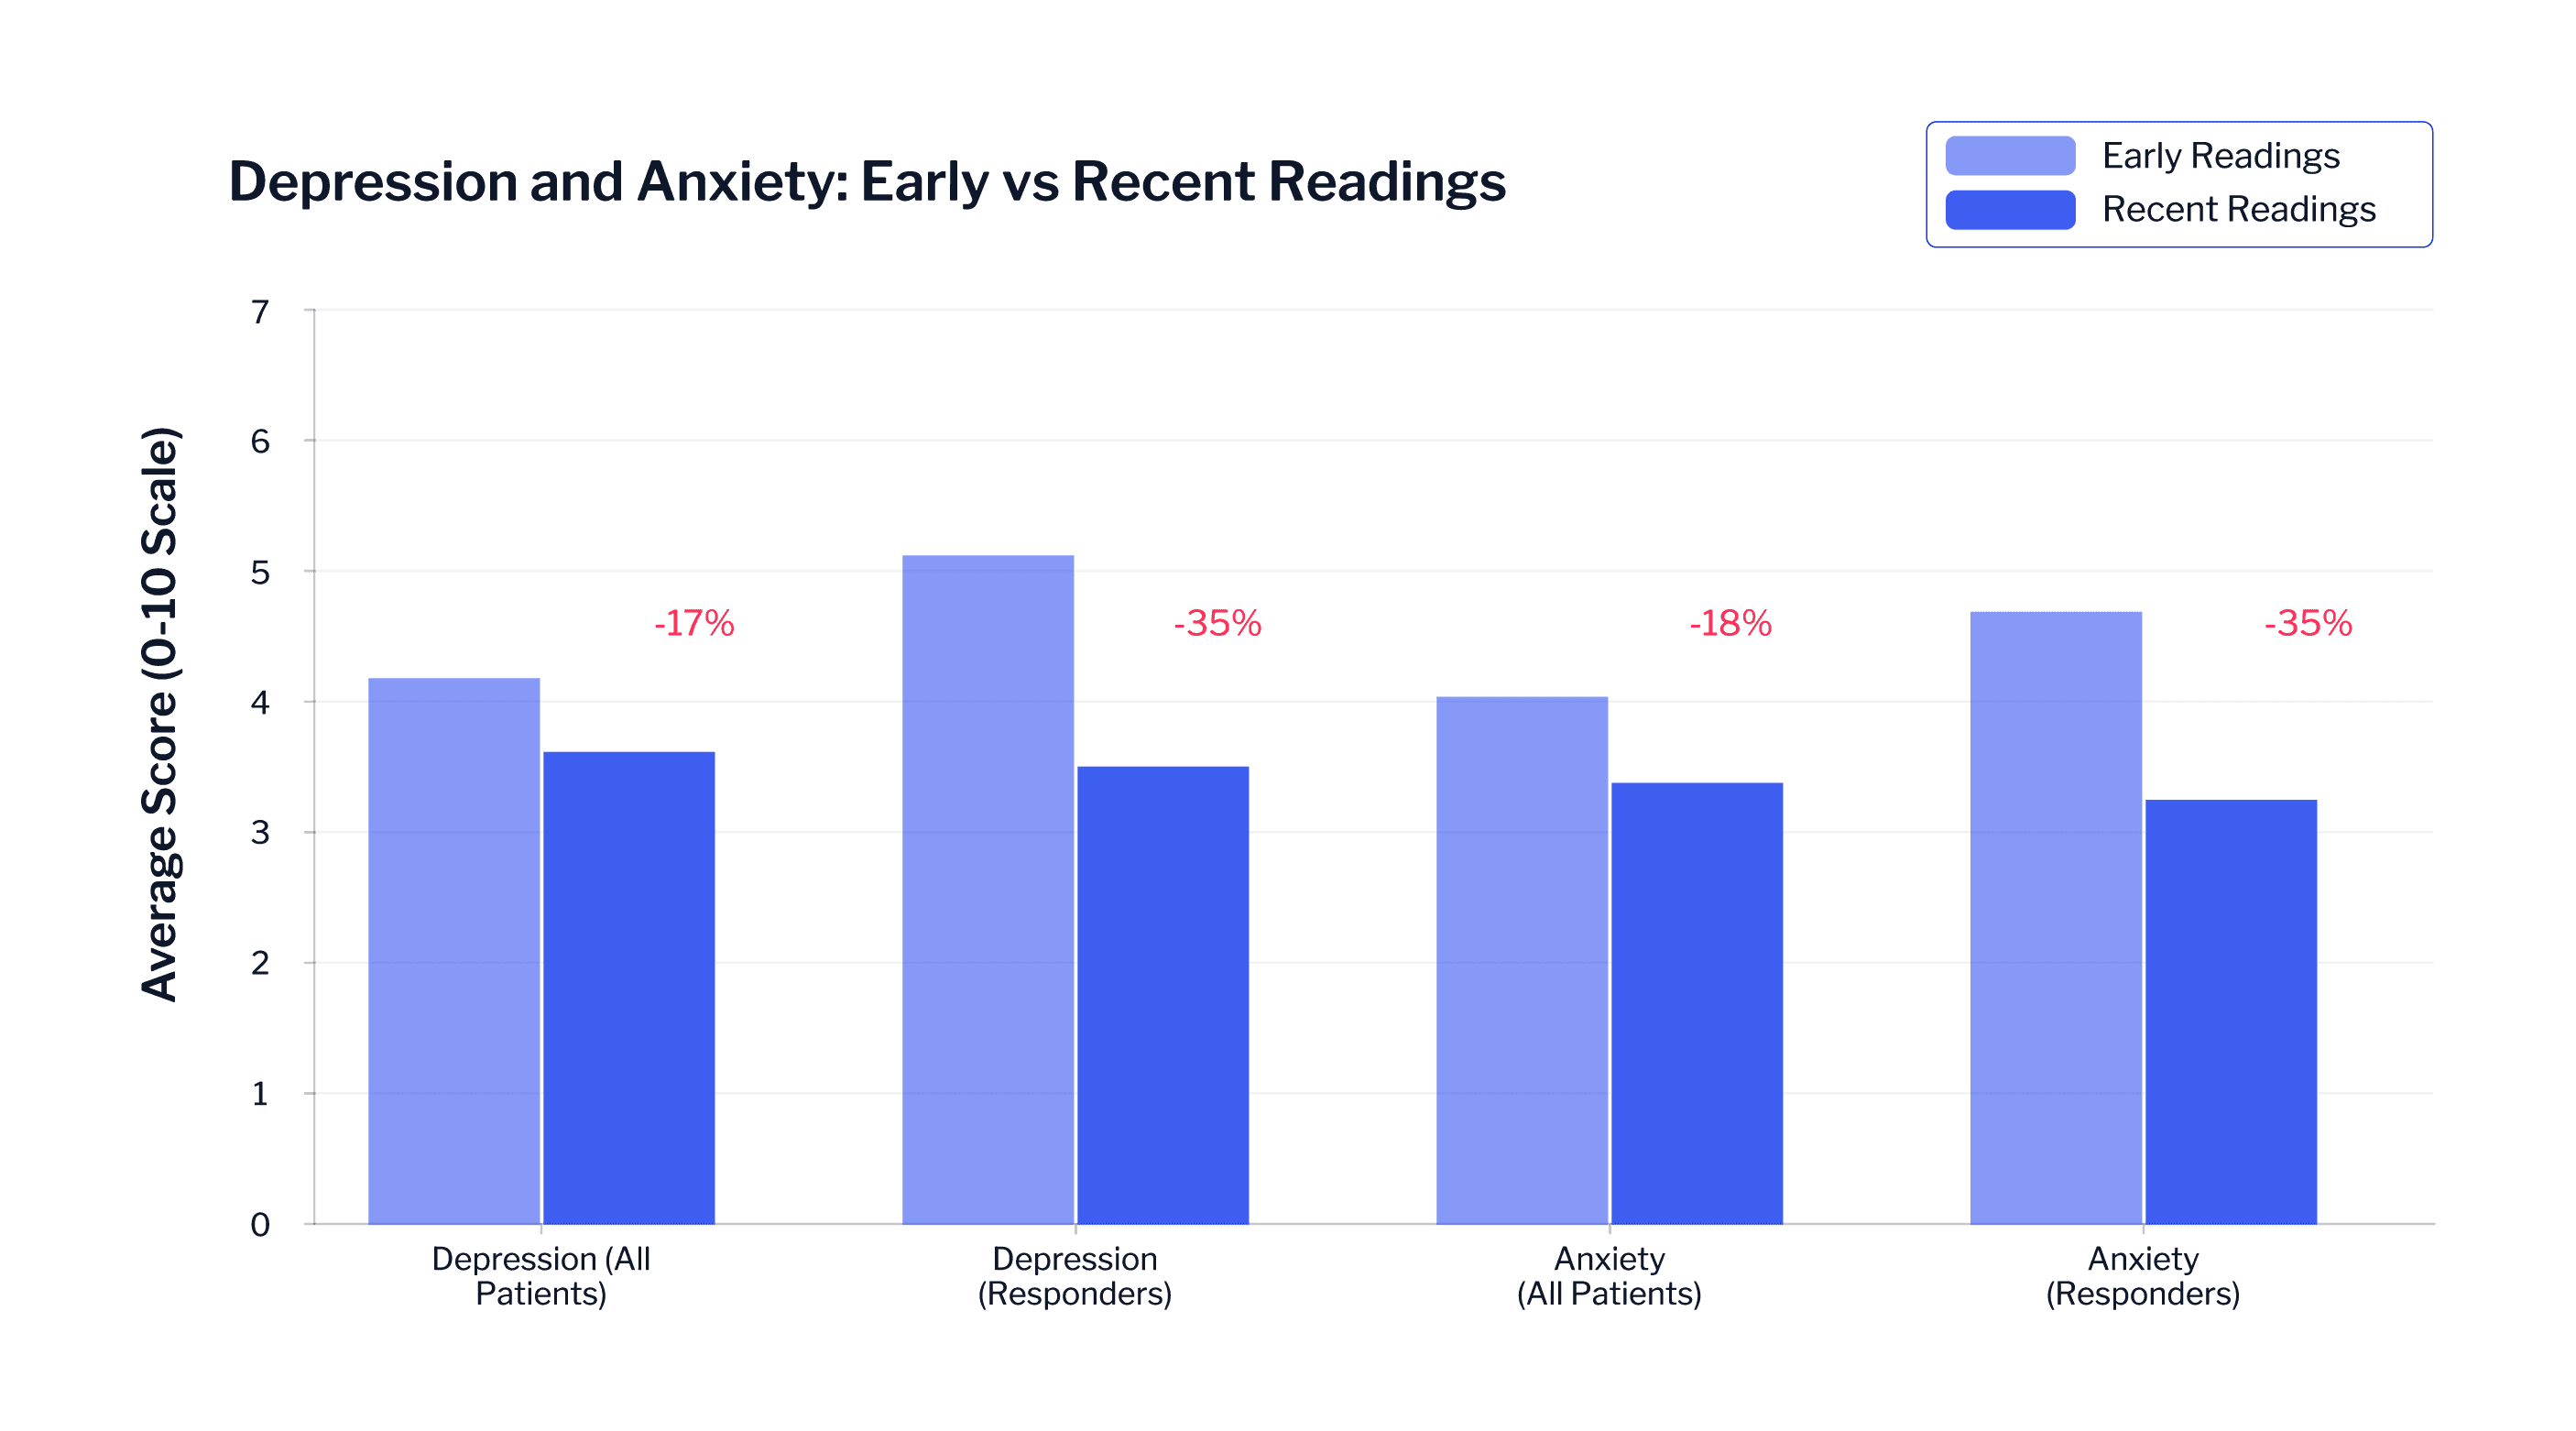
Depression and Anxiety: Early vs Recent Readings
Clinical Implications
1. What Makes the Difference in RTM
Every finding in this paper points back to the same conclusion, RTM works, but only if the platform behind it captures the right data, at the right frequency, in a way that patients will actually use.
The mental health results (r = 0.94 and 0.96 correlations with pain) were visible only because the platform tracks mood alongside pain. The 5.2x engagement effect was measurable only because the platform generates enough patient interaction to distinguish between engagement levels. The 72% improvement rate was detectable only because daily monitoring created enough early data points to identify who was responding and who was not.
None of these insights would have emerged from a simpler tool. That is the core argument of this paper, that platform design is not a secondary consideration in RTM. It is the primary determinant of whether the program produces clinical value.
2. Key Differentiators Supported by This Evidence
5.2x Improvement in Major Outcomes for Engaged Patients (431 patients, 51,265 responses). Patients who engaged consistently with the platform were 5.2 times more likely to achieve a 2 point pain improvement than those who did not (p < 0.0001). No other variable in the data came close to this effect size.
Fast Time to Response (486 patients). Most patients reached meaningful improvement early in the program, and 72% continued to get better from there. Seeing results quickly keeps patients engaged and gives providers early confirmation that the treatment plan is working.
Multi Dimensional Monitoring (831 patients, 51,265 responses). Tracking pain, mood, adherence, and treatment effectiveness in a single workflow makes it possible to see connections that no single dimension tool can detect.
High Medication Adherence (90 patients, 8,504 responses). Compliance reached 91% and stayed there for the vast majority of patients. In a field where poor adherence is one of the leading causes of treatment failure, that is a meaningful result.
Mental Health Gains Without Mental Health Treatment (248 to 264 patients). Patients who were only being treated for pain still saw over 35% improvement in depression and anxiety. Effective pain management on the platform produced real mental health benefits as a natural consequence.
Conclusion
This study looked at 831 patients and 51,265 assessments over 15 months. The results are clear.
72% of patients achieved meaningful pain improvement, with most responding early and continuing to improve over time. 37% saw significant improvement, and peak reductions averaged 4.5 points across the cohort. Patients who engaged consistently with the platform were 5.2 times more likely to hit major improvement milestones. Medication adherence reached 91%. And depression and anxiety improved in over 40% of patients as a downstream effect of better pain management, even without any direct mental health intervention.
For clinics weighing their RTM options, the lesson from this data is straightforward. The platform you choose determines the outcomes you get. A platform that captures multiple dimensions of health, keeps patients engaged, and turns data into actionable clinical intelligence will produce measurably better results than one that simply collects a pain score once a week. Actuvi was designed from the ground up around these principles, and the data in this paper shows that the design works.
72% Achieved Meaningful Improvement
10 Days Median Time to Response
5.2x MCID Lift for High Engagement
About Actuvi
Actuvi is a healthcare technology company that builds Remote Therapeutic Monitoring solutions for pain management, rehabilitation, and musculoskeletal care. The platform helps clinics capture multi dimensional patient data, generate actionable clinical insights, and measure treatment outcomes within a CMS compliant RTM framework.
To learn more, visit www.actuvi.com.
We'll email your breakdown and reach out to find a time.
Prefer to grab a time now?